ProfessionalInfographics Design
Transform complex data and information into visually stunning, easy-to-understand infographics that engage, inform, and inspire action.
Infographic Types We Create
From statistical data to complex processes, we create infographics that make information accessible and engaging
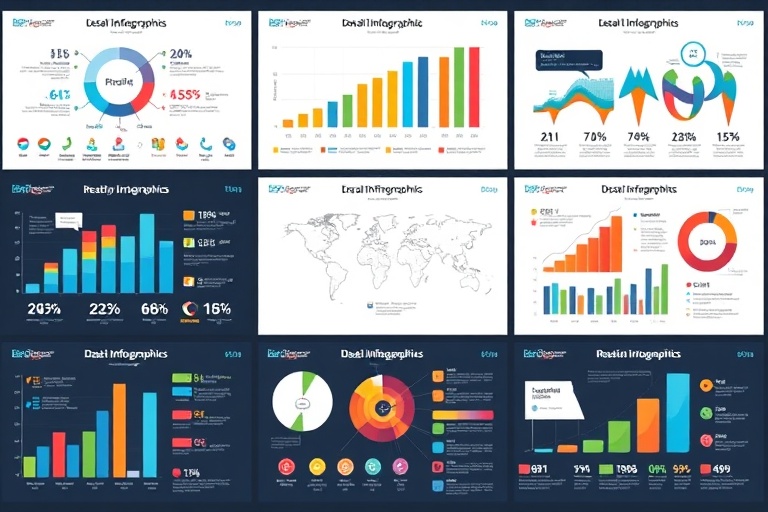
Statistical Infographics
Transform complex data and statistics into visually compelling and easy-to-understand graphics
Process Infographics
Illustrate step-by-step processes, workflows, and procedures with clear visual sequences
Comparison Infographics
Create compelling visual comparisons between products, services, or concepts
Timeline Infographics
Showcase historical events, project milestones, or company growth through engaging timelines
Our Design Process
A systematic approach to creating infographics that effectively communicate your message
Content Analysis
We analyze your content, data, and objectives to determine the best infographic approach
Concept Development
Create initial concepts and wireframes that structure your information effectively
Visual Design
Craft beautiful visual designs with your brand colors, fonts, and style guidelines
Content Integration
Integrate all content elements, ensuring perfect balance between text and visuals
Final Optimization
Polish and optimize for various formats and platforms with quality assurance
Featured Portfolio
Explore our collection of professional infographics that have driven engagement and results
UAE Economic Growth Report
Comprehensive economic data visualization showcasing UAE growth trends
Digital Transformation Journey
Step-by-step guide to digital transformation for UAE businesses
Sustainable Energy Solutions
Comprehensive comparison of renewable energy options for the region
UAE Healthcare Evolution
Historical timeline of healthcare development in the UAE
Dubai Tourism Statistics
Comprehensive tourism data and visitor statistics for Dubai
Startup Funding Process
Complete guide to startup funding stages and requirements
Why Choose Infographics?
Infographics deliver powerful results that transform how your audience engages with your content
Increased Engagement
Higher social media engagement compared to text-only content
Better Information Retention
People remember visual information better than plain text
Improved Sharing
Infographics are shared 30x more than other content types
Brand Recognition
Increase in brand recognition through visual storytelling
Client Success Stories
See what our clients say about their infographic design experience
"The infographic design exceeded our expectations! The complex economic data was transformed into a visually stunning and easily digestible format. Our stakeholders loved the professional presentation."
Director of Communications
Emirates Economic Council
"Quantum Byte UAE created an amazing process infographic for our digital transformation guide. The visual flow was perfect and helped our clients understand complex technical processes easily."
Marketing Manager
Dubai Tech Solutions
"Our healthcare timeline infographic became a viral hit! The design was both informative and visually appealing. We saw a 300% increase in engagement on our social media platforms."
Public Relations Officer
Ministry of Health UAE
Infographic Packages
Choose the perfect package for your infographic design needs
Basic Infographic
Delivery: 5-7 days
- Single infographic design
- Basic data visualization
- Standard resolution
- PNG & PDF formats
- 3 revision rounds
- Social media sizes
- Email support
Professional
Delivery: 7-10 days
- Complex infographic design
- Advanced data visualization
- High resolution output
- Multiple format delivery
- 5 revision rounds
- Interactive elements
- Print-ready files
- Priority support
- Usage rights included
Enterprise
Delivery: 10-14 days
- Multiple infographic series
- Custom illustrations
- Animated versions
- Brand guideline creation
- Unlimited revisions
- Multi-language versions
- White-label licensing
- Dedicated designer
- 24/7 support
- Full commercial rights
Ready to Transform Your DataInto Visual Stories?
Let's create stunning infographics that make your information engaging, memorable, and shareable.